Teaching Challenges Informal Survey
The results are in for Part 1 of our informal survey on teaching challenges and making in the classroom.
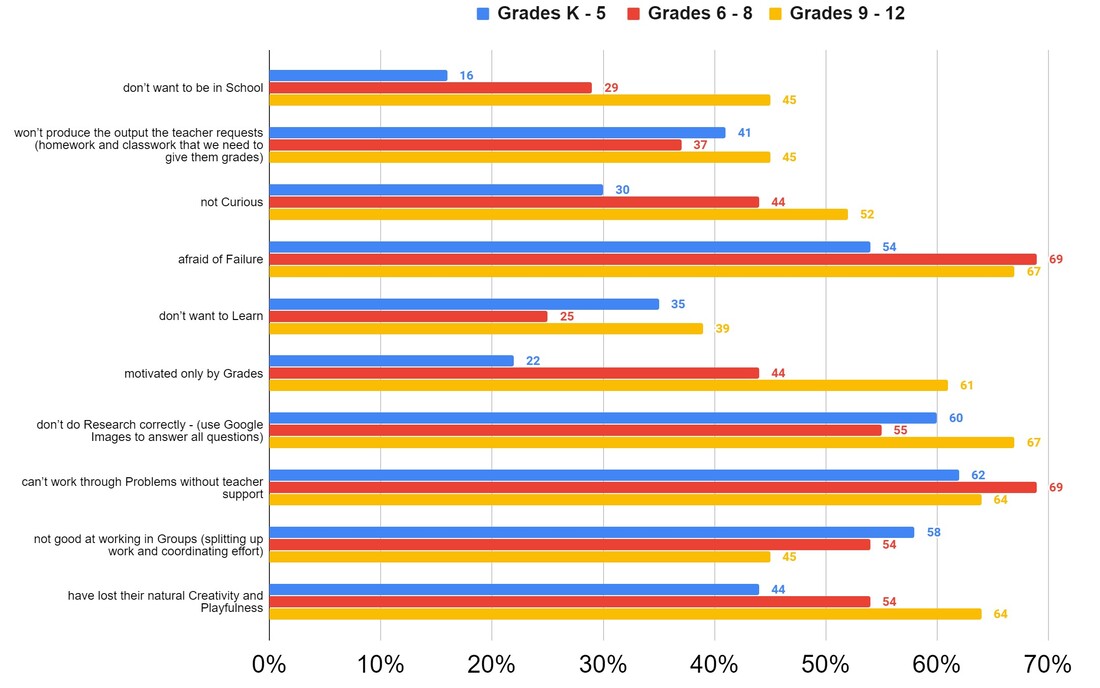
The graph below charts the responses of 89 educators who answered our survey questions about what challenging student behaviors and attitudes towards learning most affect their classrooms. We broke the data down by grade level, and scaled the results to a percentage of the total possible score (biggest impact) for each prompt.
Part 2 is now open! We are gathering data on how students' behaviors and attitudes challenge teachers when engaging in hands-on learning.
Stay tuned for the comparison where we see if students present fewer challenges during hands-on projects.